
PKS J2134-0153 with z = 1.285 (Truebenbach & Darling2017) with A. R. = 21 h 34 m 10.3095 s and DEC. = -01° 53’ 17.238” (Fomalont et al. 2000)
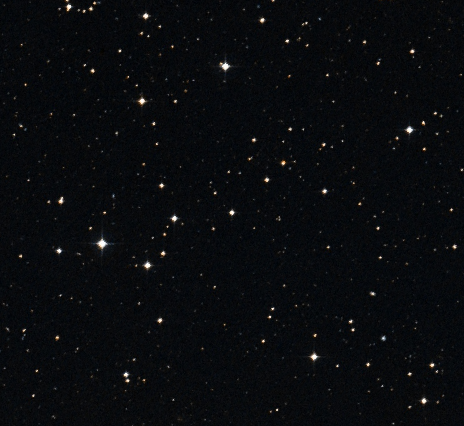
Sloan Digital Sky Survey image of J2134-0419
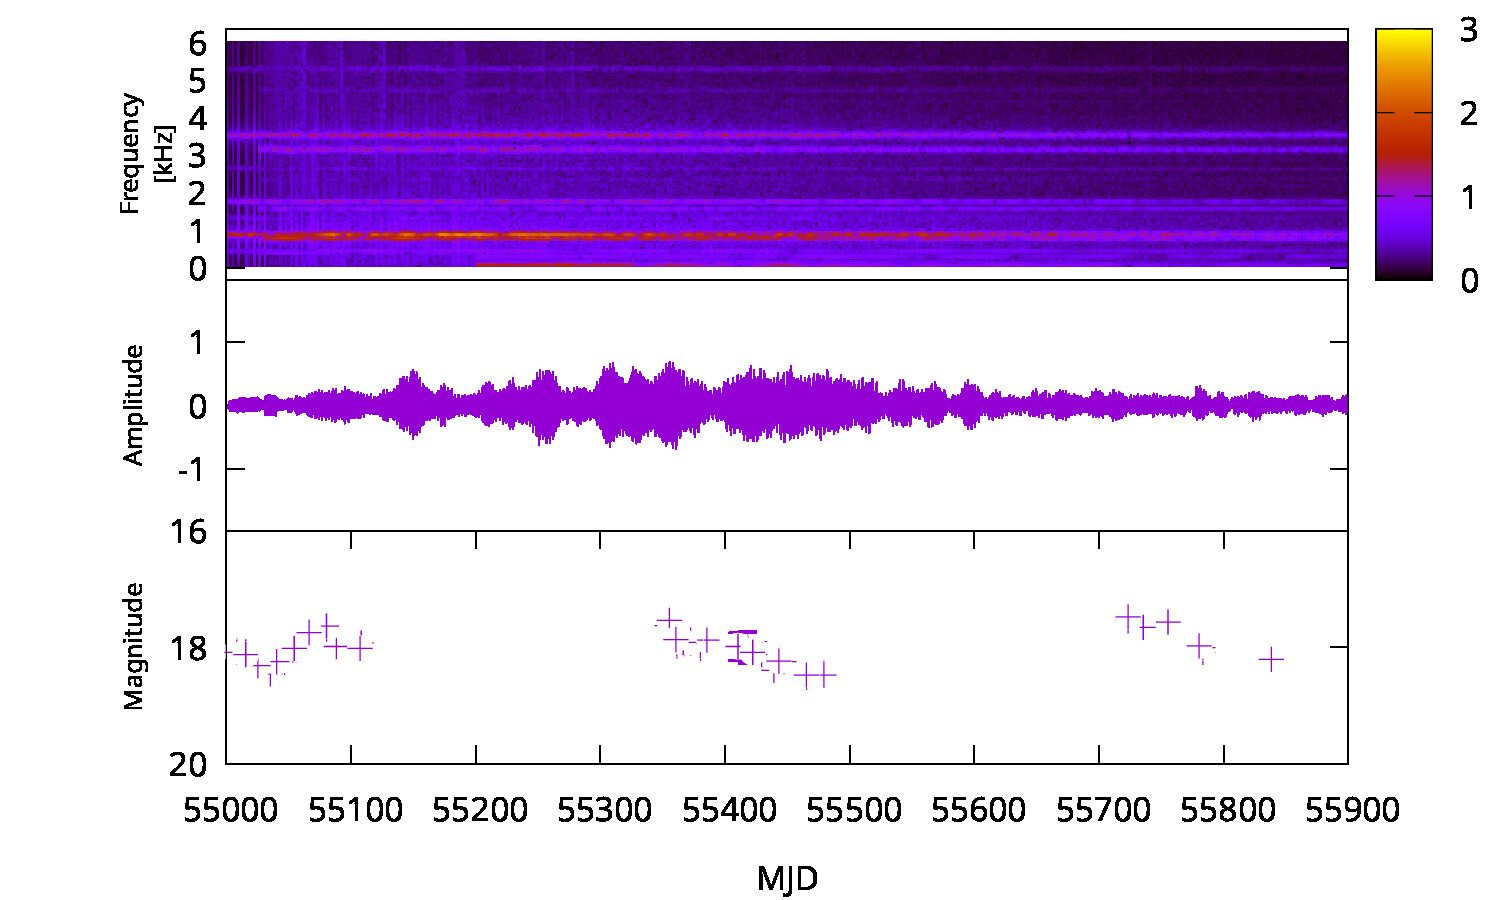
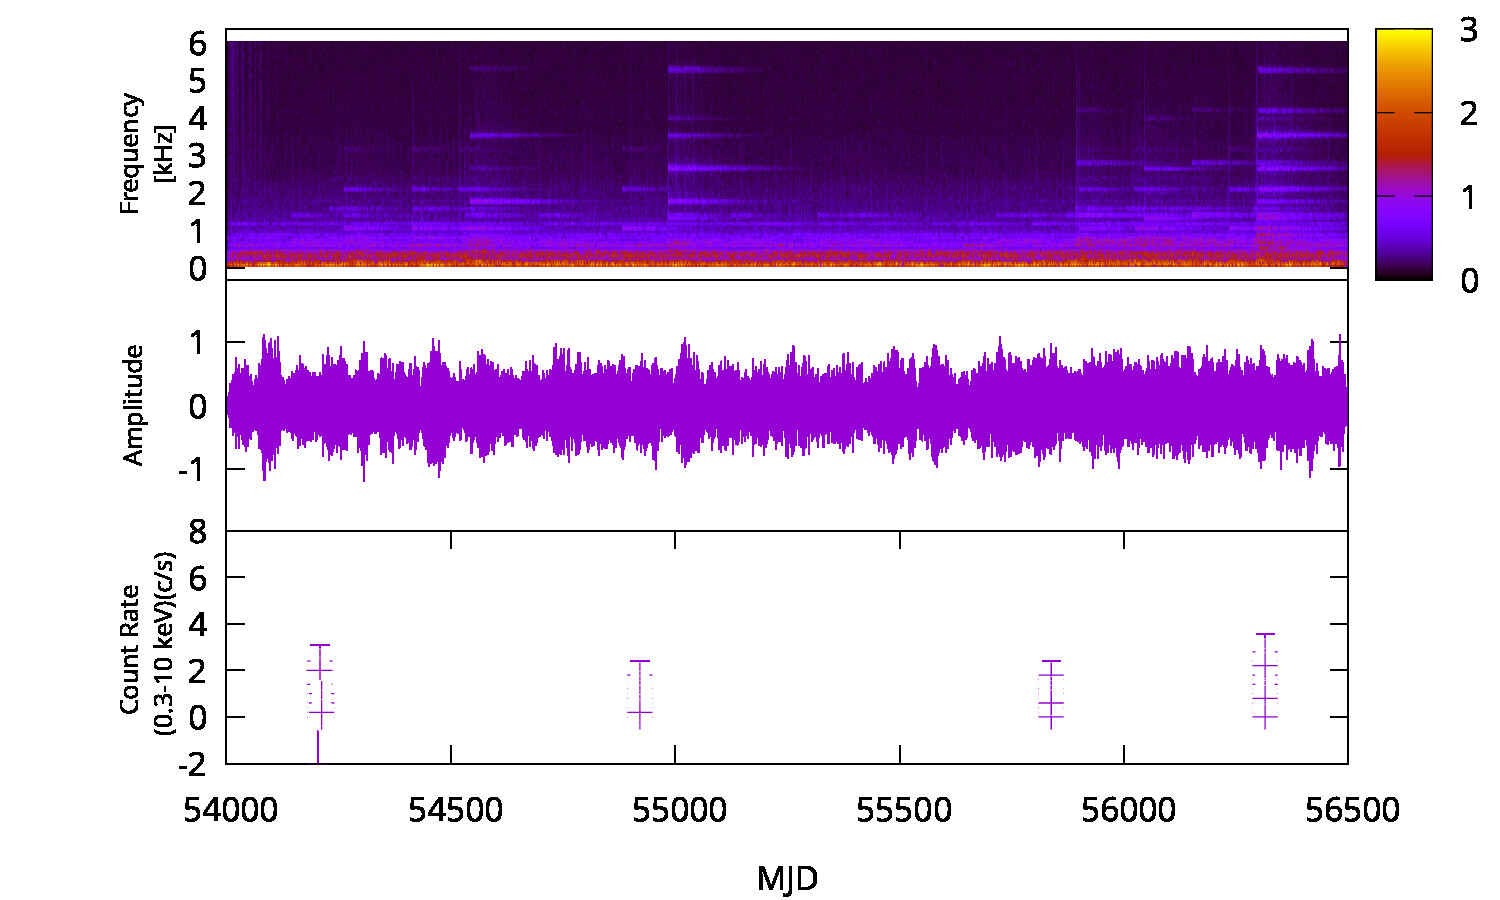
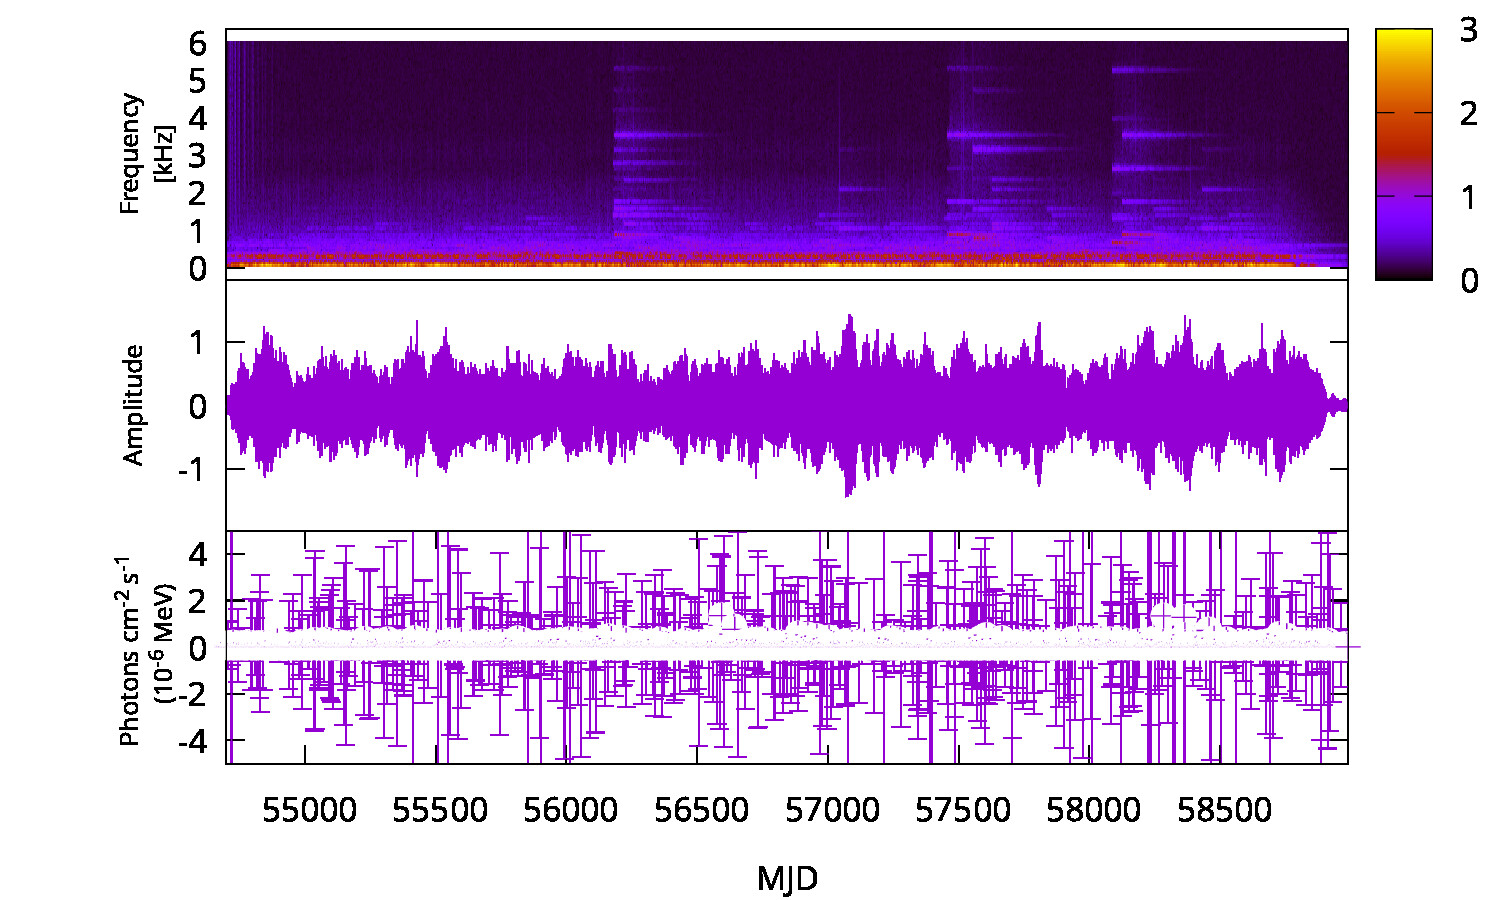
The figure shows panels of radio, optical, X-ray, and Gamma-ray light curves, waveforms of the sonification as a function of time, and spectrograms of the blazar J2134-0419. The light curves are available at: Download Light curves.
To ensure an accurate representation of the multiwavelength data and adhere to the established sonification research methodology, each frequency range must be analyzed independently. Simultaneous playback may lead to spectral masking and the loss of critical temporal features unique to each energy band. Users are therefore advised to utilize the individual playback controls to isolate each emission process, thereby preserving the scientific fidelity of the auditory mapping.
1. Listen to the audio using the Play/Pause button.
2. Use the Solo option to enable or disable one or more audio tracks.
3. You can listen to each audio individually, but you can also combine them by toggling the Mute/Solo button.